
扩展 jfreechart 的简单方法 (附例子下载)
By:Roy.LiuLast updated:2014-05-19
jFreeChart 是一个利用java 生成图表的工具,可以生成各种类型的图:柱状图,饼图,甘特图,甚至类似于股票里面的走势图等等,功能非常的强大,这是一个免费试用的工具,但作者的网站说:文档是需要收费的。其实作为一般的用法来说,不需要文档就可以完成,网上有太多的例子。我自己也参考了网上的很多例子,但现在项目中的要求是必须与另一个项目生成的 饼图,柱状图基本一致(包括颜色,大小,风格等). 这并需要太多的扩展,基本的样式,直接用 jfreechart 设置 就可以做到, 但有一点在饼图的 label 显示风格不一样,这样就只能扩展了.
先看一下,要求生成的样式如下:
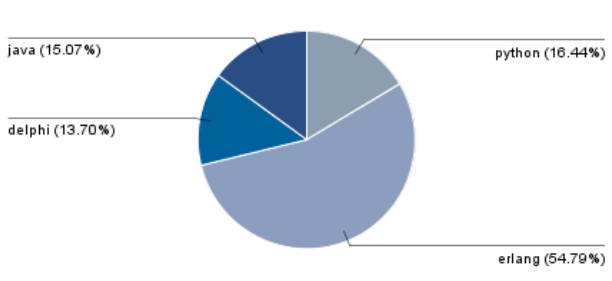
经过查询网上资料,直接用原生的 jfreechart API调整过颜色之后的图如下:
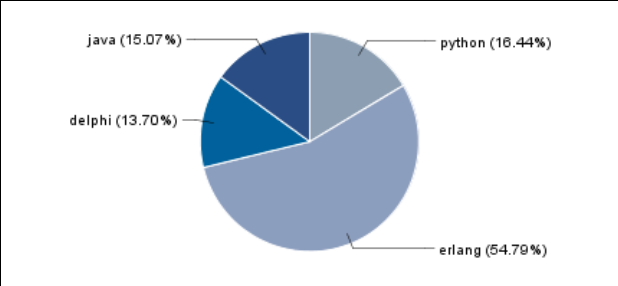
很明显,最重要的一点就是 label 的位置不一样,一个在于线并排,一个在线的下方,而且在线下方的时候,完全靠左或右对齐. 要扩展自己的 饼图类,并达到这样的效果.
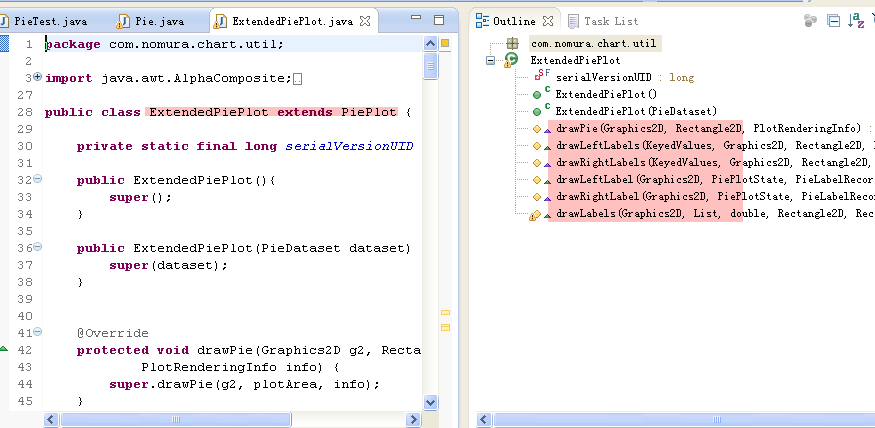
扩展的方法,在 jfreechart 中无论是饼图还是柱状图,都有对应的 Plot 类,所要进行的扩展基本都在这里面进行, 就那我自己要扩展的饼图来说, 需要继承 PiePlot 进行扩展. 需要扩展的方法如下图所示:
详细代码如下:
在扩展的代码里,因为 demo 的关系,我 hardcode 了几个数字,第一个是label 的最大宽度,在 drawLeftLabels 这样的方法中,我给了 200 这个固定宽度,原来的代码是通过计算得到的,当然自己也可以通过计算得到,由于我生成的图片大小是固定的,因此我修改成了满足自己的值,第二个 hardcode 的值是 划线的X轴坐标,我用了类似语句: double anchorX = state.getLinkArea().getMaxX() + 128; 后面的 128 是写死的,当然也可以通过计算,通过圆心的坐标,图片宽度,加上state 里面提供的参数,是可以动态计算的。
通过这样的扩展 jfreechart 基本可以满足自己的需要,另外柱状图可以采用类似的方法扩展. 整个项目的 maven 工程下载:
extend jfreechart draw labels
先看一下,要求生成的样式如下:
经过查询网上资料,直接用原生的 jfreechart API调整过颜色之后的图如下:
很明显,最重要的一点就是 label 的位置不一样,一个在于线并排,一个在线的下方,而且在线下方的时候,完全靠左或右对齐. 要扩展自己的 饼图类,并达到这样的效果.
扩展的方法,在 jfreechart 中无论是饼图还是柱状图,都有对应的 Plot 类,所要进行的扩展基本都在这里面进行, 就那我自己要扩展的饼图来说, 需要继承 PiePlot 进行扩展. 需要扩展的方法如下图所示:
详细代码如下:
 @Override
    protected void drawLeftLabels(KeyedValues leftKeys, Graphics2D g2,
            Rectangle2D plotArea, Rectangle2D linkArea, float maxLabelWidth,
            PiePlotState state) {
        this.getLabelDistributor().clear();
        double lGap = plotArea.getWidth() * this.getLabelGap();
        double verticalLinkRadius = state.getLinkArea().getHeight() / 2.0;
        for (int i = 0; i < leftKeys.getItemCount(); i++) {
            String label = this.getLabelGenerator().generateSectionLabel(
                    this.getDataset(), leftKeys.getKey(i));
            if (label != null) {
                TextBlock block = TextUtilities.createTextBlock(label,
                        this.getLabelFont(), this.getLabelPaint(), 200,
                        new G2TextMeasurer(g2));
                TextBox labelBox = new TextBox(block);
                labelBox.setBackgroundPaint(this.getLabelBackgroundPaint());
                labelBox.setOutlinePaint(this.getLabelOutlinePaint());
                labelBox.setOutlineStroke(this.getLabelOutlineStroke());
                labelBox.setShadowPaint(this.getLabelShadowPaint());
                labelBox.setInteriorGap(this.getLabelPadding());
                double theta = Math.toRadians(
                        leftKeys.getValue(i).doubleValue());
                double baseY = state.getPieCenterY() - Math.sin(theta)
                               * verticalLinkRadius;
                double hh = labelBox.getHeight(g2);

                this.getLabelDistributor().addPieLabelRecord(new PieLabelRecord(
                        leftKeys.getKey(i), theta, baseY, labelBox, hh,
                        lGap / 2.0 + lGap / 2.0 * -Math.cos(theta), 1.0
                        - getLabelLinkDepth()
                        + getExplodePercent(leftKeys.getKey(i))));
            }
        }
        double hh = plotArea.getHeight();
        double gap = hh * getInteriorGap();
        this.getLabelDistributor().distributeLabels(plotArea.getMinY() + gap,
                hh - 2 * gap);
        for (int i = 0; i < this.getLabelDistributor().getItemCount(); i++) {
            drawLeftLabel(g2, state,
                    this.getLabelDistributor().getPieLabelRecord(i));
        }
    }

    @Override
    protected void drawRightLabels(KeyedValues keys, Graphics2D g2,
            Rectangle2D plotArea, Rectangle2D linkArea, float maxLabelWidth,
            PiePlotState state) {
     // draw the right labels...
        this.getLabelDistributor().clear();
        double lGap = plotArea.getWidth() * this.getLabelGap();
        double verticalLinkRadius = state.getLinkArea().getHeight() / 2.0;

        for (int i = 0; i < keys.getItemCount(); i++) {
            String label = this.getLabelGenerator().generateSectionLabel(
                    this.getDataset(), keys.getKey(i));

            if (label != null) {
                TextBlock block = TextUtilities.createTextBlock(label,
                        this.getLabelFont(), this.getLabelPaint(), 200,
                        new G2TextMeasurer(g2));
                TextBox labelBox = new TextBox(block);
                labelBox.setBackgroundPaint(this.getLabelBackgroundPaint());
                labelBox.setOutlinePaint(this.getLabelOutlinePaint());
                labelBox.setOutlineStroke(this.getLabelOutlineStroke());
                labelBox.setShadowPaint(this.getLabelShadowPaint());
                labelBox.setInteriorGap(this.getLabelPadding());
                double theta = Math.toRadians(keys.getValue(i).doubleValue());
                double baseY = state.getPieCenterY()
                              - Math.sin(theta) * verticalLinkRadius;
                double hh = labelBox.getHeight(g2);
                this.getLabelDistributor().addPieLabelRecord(new PieLabelRecord(
                        keys.getKey(i), theta, baseY, labelBox, hh,
                        lGap / 2.0 + lGap / 2.0 * Math.cos(theta),
                        1.0 - getLabelLinkDepth()
                        + getExplodePercent(keys.getKey(i))));
            }
        }
        double hh = plotArea.getHeight();
        double gap = hh * getInteriorGap();
        this.getLabelDistributor().distributeLabels(plotArea.getMinY() + gap,
                hh - 2 * gap);
        for (int i = 0; i < this.getLabelDistributor().getItemCount(); i++) {
            drawRightLabel(g2, state,
                    this.getLabelDistributor().getPieLabelRecord(i));
        }

    }

    @Override
    protected void drawLeftLabel(Graphics2D g2, PiePlotState state,
            PieLabelRecord record) {
        double anchorX = state.getLinkArea().getMinX() - 129;
        double targetX = anchorX;
        double targetY = record.getAllocatedY();

        if ( getLabelLinksVisible() ) {
            double theta = record.getAngle();
            double linkX = state.getPieCenterX() + Math.cos(theta)
                    * state.getPieWRadius() * record.getLinkPercent();
            double linkY = state.getPieCenterY() - Math.sin(theta)
                    * state.getPieHRadius() * record.getLinkPercent();
            double elbowX = state.getPieCenterX() + Math.cos(theta)
                    * state.getLinkArea().getWidth() / 2.0;
            double elbowY = state.getPieCenterY() - Math.sin(theta)
                    * state.getLinkArea().getHeight() / 2.0;
            double anchorY = elbowY;

            g2.setPaint( getLabelLinkPaint() );
            g2.setStroke( getLabelLinkStroke() );
            PieLabelLinkStyle style = getLabelLinkStyle();
            if (style.equals(PieLabelLinkStyle.STANDARD)) {
                g2.draw(new Line2D.Double(linkX, linkY, elbowX, elbowY));
                g2.draw(new Line2D.Double(anchorX, anchorY, elbowX, elbowY));
                g2.draw(new Line2D.Double(anchorX, anchorY, targetX, targetY));
            }
            else if (style.equals(PieLabelLinkStyle.QUAD_CURVE)) {
                QuadCurve2D q = new QuadCurve2D.Float();
                q.setCurve(targetX, targetY, anchorX, anchorY, elbowX, elbowY);
                g2.draw(q);
                g2.draw(new Line2D.Double(elbowX, elbowY, linkX, linkY));
            }
            else if (style.equals(PieLabelLinkStyle.CUBIC_CURVE)) {
                CubicCurve2D c = new CubicCurve2D .Float();
                c.setCurve(targetX, targetY, anchorX, anchorY, elbowX, elbowY,
                        linkX, linkY);
                g2.draw(c);
            }
        }
        TextBox tb = record.getLabel();
        tb.setShadowXOffset(0D);
        tb.setShadowXOffset(0D);
        tb.setInteriorGap(new RectangleInsets(0D, 2D, 0D, 0D));
        tb.draw(g2, (float) targetX - 2 , (float) targetY + 8, RectangleAnchor.LEFT);
    }

    @Override
    protected void drawRightLabel(Graphics2D g2, PiePlotState state,
            PieLabelRecord record) {
        double anchorX = state.getLinkArea().getMaxX() + 128;
        double targetX = anchorX ;
        double targetY = record.getAllocatedY();

        if (this.getLabelLinksVisible()) {
            double theta = record.getAngle();
            double linkX = state.getPieCenterX() + Math.cos(theta)
                    * state.getPieWRadius() * record.getLinkPercent();
            double linkY = state.getPieCenterY() - Math.sin(theta)
                    * state.getPieHRadius() * record.getLinkPercent();
            double elbowX = state.getPieCenterX() + Math.cos(theta)
                    * state.getLinkArea().getWidth() / 2.0;
            double elbowY = state.getPieCenterY() - Math.sin(theta)
                    * state.getLinkArea().getHeight() / 2.0 ;
            double anchorY = elbowY;
            g2.setPaint(this.getLabelLinkPaint());
            g2.setStroke(this.getLabelLinkStroke());
            PieLabelLinkStyle style = getLabelLinkStyle();
            if (style.equals(PieLabelLinkStyle.STANDARD)) {
                g2.draw(new Line2D.Double(linkX, linkY, elbowX, elbowY));
                g2.draw(new Line2D.Double(anchorX, anchorY, elbowX, elbowY));
                g2.draw(new Line2D.Double(anchorX, anchorY, targetX, targetY));
            }
            else if (style.equals(PieLabelLinkStyle.QUAD_CURVE)) {
                QuadCurve2D q = new QuadCurve2D.Float();
                q.setCurve(targetX, targetY, anchorX, anchorY, elbowX, elbowY);
                g2.draw(q);
                g2.draw(new Line2D.Double(elbowX, elbowY, linkX, linkY));
            }
            else if (style.equals(PieLabelLinkStyle.CUBIC_CURVE)) {
                CubicCurve2D c = new CubicCurve2D .Float();
                c.setCurve(targetX, targetY, anchorX, anchorY, elbowX, elbowY,
                        linkX, linkY);
                g2.draw(c);
            }
        }
        TextBox tb = record.getLabel();
        tb.setShadowXOffset(0D);
        tb.setShadowXOffset(0D);
        tb.setInteriorGap(new RectangleInsets(0D, 0D, 0D, 0D));
        tb.draw(g2, (float) targetX , (float) targetY + 8, RectangleAnchor.RIGHT);
    }

    @Override
    protected void drawLabels(Graphics2D g2, List keys, double totalValue,
            Rectangle2D plotArea, Rectangle2D linkArea, PiePlotState state) {
        Composite originalComposite = g2.getComposite();
        g2.setComposite(AlphaComposite.getInstance(AlphaComposite.SRC_OVER,
                1.0f));

        // classify the keys according to which side the label will appear...
        DefaultKeyedValues leftKeys = new DefaultKeyedValues();
        DefaultKeyedValues rightKeys = new DefaultKeyedValues();

        double runningTotal = 0.0;
        Iterator iterator = keys.iterator();
        while (iterator.hasNext()) {
            Comparable key = (Comparable) iterator.next();
            boolean include = true;
            double v = 0.0;
            Number n = this.getDataset().getValue(key);
            if (n == null) {
                include = !this.getIgnoreNullValues();
            }
            else {
                v = n.doubleValue();
                include = this.getIgnoreZeroValues() ? v > 0.0 : v >= 0.0;
            }

            if (include) {
                runningTotal = runningTotal + v;
                // work out the mid angle (0 - 90 and 270 - 360) = right,
                // otherwise left
                double mid = this.getStartAngle() + (this.getDirection().getFactor()
                        * ((runningTotal - v / 2.0) * 360) / totalValue);
                if (Math.cos(Math.toRadians(mid)) < 0.0) {
                    leftKeys.addValue(key, new Double(mid));
                }
                else {
                    rightKeys.addValue(key, new Double(mid));
                }
            }
        }

        g2.setFont(getLabelFont());

        // calculate the max label width from the plot dimensions, because
        // a circular pie can leave a lot more room for labels...
        double marginX= plotArea.getX() + this.getInteriorGap()
                * plotArea.getWidth();
        double gap = plotArea.getWidth() * this.getLabelGap();
        double ww = linkArea.getX() - gap - marginX;
        float labelWidth = (float) this.getLabelPadding().trimWidth(ww);

        // draw the labels...
        if (this.getLabelGenerator() != null) {
            drawLeftLabels(leftKeys, g2, plotArea, linkArea, labelWidth,
                    state);
            drawRightLabels(rightKeys, g2, plotArea, linkArea, labelWidth,
                    state);
        }
        g2.setComposite(originalComposite);

    }
在扩展的代码里,因为 demo 的关系,我 hardcode 了几个数字,第一个是label 的最大宽度,在 drawLeftLabels 这样的方法中,我给了 200 这个固定宽度,原来的代码是通过计算得到的,当然自己也可以通过计算得到,由于我生成的图片大小是固定的,因此我修改成了满足自己的值,第二个 hardcode 的值是 划线的X轴坐标,我用了类似语句: double anchorX = state.getLinkArea().getMaxX() + 128; 后面的 128 是写死的,当然也可以通过计算,通过圆心的坐标,图片宽度,加上state 里面提供的参数,是可以动态计算的。
通过这样的扩展 jfreechart 基本可以满足自己的需要,另外柱状图可以采用类似的方法扩展. 整个项目的 maven 工程下载:
extend jfreechart draw labels
From:一号门
Previous:做日本,香港外包项目的感受
COMMENTS